


Estimated Reading Time: 28-32 minutes (5,727 words)
1. Introduction
In 2025, India’s housing market stands at a critical crossroads — shaped by changing interest rates, rapid urban migration, and shifting affordability dynamics. After a period of steep borrowing costs in 2022–23, the Reserve Bank of India’s rate cuts in 2025 have brought partial relief to home loan borrowers, improving overall housing affordability. Yet, prices in most Tier-1 cities haven’t cooled much. According to The Economic Times and Reuters surveys, average property prices in major metros like Mumbai, Bengaluru, and Delhi NCR rose by 5–7% in 2024–25, even as rent inflation in prime localities touched 10–15%. This means both buyers and tenants are feeling the squeeze — just in different ways.
For many Indians, the rent-versus-buy debate is no longer just emotional; it’s a strategic money decision. The average EMI for a 2-BHK apartment in cities like Mumbai or Gurugram now exceeds ₹70,000–₹90,000 per month, while a similar home can be rented for ₹40,000–₹50,000. In contrast, in emerging cities like Hyderabad or Pune, the gap is narrower — making ownership potentially viable if you’re planning a long-term stay. Add in tax deductions, appreciation potential, and lifestyle goals, and the choice becomes deeply personal yet financially consequential.
That’s why this article doesn’t stop at opinions — it brings data-driven clarity. We’ll break down the real numbers from five major Indian cities, compare rental yields vs home loan EMIs, and introduce a simple rent-vs-buy calculator you can use with your own figures. Whether you’re a salaried professional deciding between renting or buying your first home, or an investor exploring yield opportunities, this guide will help you make a confident, financially sound choice in today’s market landscape.

Quick market snapshot (India: 2024 → mid-2025)
- Mortgage / lending environment: RBI delivered cuts through 2025, bringing the repo rate down (June 6, 2025 repo reported at 5.50%), and many lenders refreshed home loan offers — typical retail home-loan offers for good customers are in the mid-7% range (banks advertise ~7.65% as one sample). Lower policy rates translate to cheaper EMIs when lenders pass cuts to borrowers. bajajhousingfinance.in+1
- Price momentum: Residential prices across major Indian cities remained positive in 2024–25; JLL and other trackers show city-level YoY price rises (e.g., Delhi NCR and Bengaluru among the stronger gainers in 2025). Reuters polls/analyses estimated ~6–7% national home price rise in 2025 (headline). jll.com+1
- Rental yields: India’s gross rental yield averaged ~4.8% (Q2 2025), up from prior periods — rent growth in tech & job hubs has supported yields. But yields remain modest vs many western countries; local micro-markets vary widely. globalpropertyguide.com+1
Bottom line: in 2025 the rent-vs-buy question is strongly local — interest-rate moves, price per sqft and local rents determine cashflow parity.
How we compare rent vs buy (assumptions, formula & worked example)
Why we fix a standard scenario
To make fair, repeatable comparisons across cities we use a transparent baseline scenario you (or your readers) can copy, tweak, and re-run. Comparing rent vs buy requires more than a single monthly number — it needs consistent assumptions for unit size, loan structure, tenure, maintenance, transaction costs and the time horizon for ownership. These assumptions are deliberately conservative and easy to change:
Standard example inputs (copyable)
- Unit size: 900 sq ft (typical 2-BHK used in India city comparisons)
- Purchase price: price_per_sqft × area_sqft (fill in city value)
- Down payment: 20% of purchase price (you can test 10%, 30% etc.)
- Loan: 80% LTV (loan principal = 80% of purchase price)
- Interest rate (annual): 7.5% p.a. (example retail home-loan rate; replace with your lender’s rate)
- Tenure: 20 years (240 months) — common choice balancing EMI affordability and total interest
- Maintenance + property tax (monthly): ₹3,500–5,500 (use your local building/municipal numbers)
- Annual price appreciation (conservative): 5% (city dependent — replace with local forecasts)
- Purchasing transaction costs: ~6–8% of purchase price (stamp duty, registration, brokerage, legal fees) — important for total cost but not part of EMI
- Rent: market rent per month for a comparable 2-BHK (city-sourced)
Primary comparison shown in the article:
Monthly Owning Cost = EMI + Monthly maintenance + (monthly property tax estimate)
vs
Monthly Renting Cost = Market rent
That immediate monthly cashflow comparison is what most readers care about, but we also model longer-term net-worth differences (equity built + appreciation − fees vs invested savings from renting). A downloadable sheet implements the longer model.
EMI formula (with step-by-step substitution)
We use the standard loan EMI formula:
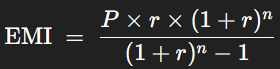
where:
- P = loan principal (₹)
- r = monthly interest rate = annual_rate / 12
- n = total months = years × 12
Worked numeric example (digit-by-digit): use the Bengaluru sample from the article as an illustration.
- Area = 900 sq ft
- Price_per_sqft (Bengaluru sample) = ₹7,881 → Purchase_price = ₹7,881 × 900 = ₹70,92,900.
- Down payment (20%) = ₹70,92,900 × 0.20 = ₹14,18,580.
- Loan principal (80%) P = ₹70,92,900 × 0.80 = ₹56,74,320.
Assume annual rate = 7.5%, tenure = 20 years:
- Monthly rate r=0.075/12=0.00625r = 0.075/12 = 0.00625r=0.075/12=0.00625.
- Number of months n=20×12=240n = 20 \times 12 = 240n=20×12=240.
- Compute (1+r)n=(1.00625)240=4.46081703140557(1+r)^n = (1.00625)^{240} = 4.46081703140557(1+r)n=(1.00625)240=4.46081703140557.
- Compute numerator: P×r×(1+r)n=5,674,320×0.00625×4.46081703140557=158,200.64561028284P \times r \times (1+r)^n = 5,674,320 \times 0.00625 \times 4.46081703140557 = 158,200.64561028284P×r×(1+r)n=5,674,320×0.00625×4.46081703140557=158,200.64561028284.
- (Step: P×r=5,674,320×0.00625=35,464.5P \times r = 5,674,320 \times 0.00625 = 35,464.5P×r=5,674,320×0.00625=35,464.5. Then ×4.46081703140557=158,200.6456\times 4.46081703140557 = 158,200.6456×4.46081703140557=158,200.6456.)
- (Step: P×r=5,674,320×0.00625=35,464.5P \times r = 5,674,320 \times 0.00625 = 35,464.5P×r=5,674,320×0.00625=35,464.5. Then ×4.46081703140557=158,200.6456\times 4.46081703140557 = 158,200.6456×4.46081703140557=158,200.6456.)
- Compute denominator: (1+r)n−1=4.46081703140557−1=3.46081703140557(1+r)^n – 1 = 4.46081703140557 – 1 = 3.46081703140557(1+r)n−1=4.46081703140557−1=3.46081703140557.
- EMI = numerator / denominator = 158,200.64561028284/3.46081703140557=45,711.93570034863158,200.64561028284 / 3.46081703140557 = 45,711.93570034863158,200.64561028284/3.46081703140557=45,711.93570034863.
Rounded EMI ≈ ₹45,712 / month.
(That’s the number we show in the Bengaluru worked example. You can substitute your own P, r, and n into the same steps or use the Excel =PMT(rate/12, tenure*12, -loan) formula.)
Sensitivity — why small changes matter
EMI (and therefore monthly parity vs rent) changes materially with small shifts in interest rate, tenure or loan size. To illustrate, keeping the same loan principal P=₹56,74,320P = ₹56,74,320P=₹56,74,320, here are a few common scenarios:
EMI for P = ₹56,74,320
- At 6.5% p.a., tenure 15 years → EMI ≈ ₹49,429
- At 6.5% p.a., tenure 20 years → EMI ≈ ₹42,306
- At 6.5% p.a., tenure 25 years → EMI ≈ ₹38,313
- At 7.5% p.a., tenure 15 years → EMI ≈ ₹52,602
- At 7.5% p.a., tenure 20 years → EMI ≈ ₹45,712 (baseline)
- At 7.5% p.a., tenure 25 years → EMI ≈ ₹41,933
- At 8.5% p.a., tenure 20 years → EMI ≈ ₹49,243
Implications:
- Increasing tenure from 15 → 25 years can reduce monthly EMI by ~20–25% for the same principal, at the cost of higher total interest paid.
- A 1% point rise in annual rate (e.g., 6.5% → 7.5%) can increase EMI noticeably (several thousand rupees per month for typical loans), so interest-rate direction matters.
- Reducing loan principal (via a larger down payment or buying a smaller/cheaper unit) is the most direct way to lower EMI.
Other cost items & the full comparison
When readers do the monthly comparison, remind them to account for:
- Monthly maintenance & property tax (we used ₹3,500–5,500 as a practical range) — add to EMI for owning cost.
- Transaction costs (stamp duty, registration, brokerage) — one-time but large (6–8% of price) and should be amortized over expected holding years in net-worth calculations.
- Opportunity cost of the down payment: money used for down payment could instead be invested (e.g., equity/fixed income). The calculator models this by assuming an annual investment return on the down payment.
- Tax benefits: in India, principal and interest offer deductions (sections like 80C/24) which reduce effective owning cost — model conservatively (don’t treat full tax benefit as guaranteed extra return).
- Vacancy, maintenance & management if buying for rental income — these reduce net yield.
How to use the calculator & recommended knobs to test
Encourage readers to try the following scenarios in the downloadable sheet:
- Short-stay vs long-stay: compare 3, 7 and 12 year horizons (transaction costs hurt short stays).
- Down payment test: 10% vs 20% vs 30% — see EMI and effective annualized return.
- Rate shock test: model rates at ±1% and observe EMI changes.
- Investment alternative: invest the difference (rent vs own cashflow) at assumed return rates (e.g., 6%, 10%) to compare net worth after n years.
City-by-City Worked Examples — Numbers, Data & Verdicts
Data & Methodology
To make this comparison truly representative of real-world buyer decisions, we’ve used verified property price and rent data from multiple credible sources including GlobalPropertyGuide (Q2 2025 pricing data), Housing.com, 99acres, MagicBricks, Rentok, ICICI Bank Home Loan pages, and RBI repo rate updates.
All EMI calculations assume:
- Unit size: 900 sq ft (2-BHK)
- Down payment: 20% of property value
- Loan-to-value ratio (LTV): 80%
- Interest rate: 7.5% p.a. (RBI’s repo-linked rate; ICICI, HDFC, SBI mid-2025 average ~7.5–7.7%)
- Tenure: 20 years (240 months)
- Maintenance + Property tax: ₹3,500–₹5,500/month (average across metros)
- Stamp duty + registration + brokerage: 6–8% (not included in EMI but vital for total ownership cost)
- Rent values: Based on mid-range 2-BHK rates (as of mid-2025)
We first compare monthly cashflow (EMI + maintenance vs Rent) — the most immediate decision metric — and then interpret long-term wealth implications (equity + appreciation) for each city.
A. Mumbai Metropolitan Region (MMR)
Avg price/sq ft (Q2 2025): ₹12,805
Source: GlobalPropertyGuide
- Representative property price (900 sq ft): ₹12,805 × 900 = ₹1.15 crore
- Down payment (20%): ₹23.05 lakh
- Loan (80%): ₹92.20 lakh
- EMI (20 yrs, 7.5%): ₹74,272/month
- Typical 2-BHK rent: ₹35,000/month (Andheri/Bandra 45k–65k)
- Monthly gap: ₹39,000 (EMI > Rent)
Verdict:
Mumbai continues to be India’s most expensive housing market with homeownership affordability stretched. Even after RBI’s rate cuts in 2025, EMI commitments for mid-range 2-BHKs remain double typical rent levels. Unless you have a high income, plan a 10+ year stay, or buy in high-growth submarkets (Thane, Navi Mumbai), renting is far more cashflow-efficient. However, property appreciation potential and limited land supply make long-term ownership attractive for capital growth investors.
Sources: GlobalPropertyGuide Q2 2025, Housing.com, Homebazaar.com
B. Bengaluru
Avg price/sq ft (Q2 2025): ₹7,881
Representative property price: ₹70.9 lakh
Loan (80%): ₹56.74 lakh
EMI: ₹45,712/month
Avg 2-BHK rent: ₹31,852/month (Whitefield, Electronic City, Hebbal range: ₹28k–₹38k)
Monthly gap: ₹13.9k (EMI > Rent)
Verdict:
In Bengaluru, the EMI-to-rent gap is narrower, thanks to relatively moderate property prices and strong tech-driven demand. The city’s high job stability and rental appreciation (6–8% annually since 2023) improve ownership attractiveness over time. If you plan to stay 5–10 years or want to lock in current rates, buying can outperform renting — particularly in IT corridors and new metro-linked suburbs. Renters, however, still enjoy short-term liquidity benefits.
Sources: Housing.com, GlobalPropertyGuide
C. Delhi NCR (New Delhi, Gurugram, Noida)
Avg price/sq ft (Q2 2025): ₹8,108
Property price: ₹72.97 lakh
Loan (80%): ₹58.38 lakh
EMI: ₹47,029/month
Avg rent (2-BHK): ₹30,000/month (Gurugram/Noida average range ₹28k–₹40k)
Monthly gap: ₹17k (EMI > Rent)
Verdict:
Delhi NCR presents a mixed rent vs buy scenario. In Noida and Dwarka, rents remain affordable relative to EMIs, favoring renters. But in Gurugram’s DLF and Golf Course Road sectors, capital values and infrastructure push long-term appreciation potential. For professionals planning long-term residence or with high disposable incomes, buying in select micro-markets may yield superior equity returns. Short-term residents, however, save more by renting and reinvesting the difference.
Sources: Housing.com, GlobalPropertyGuide
D. Pune
Avg price/sq ft (Q2 2025): ₹7,109
Property price: ₹63.98 lakh
Loan (80%): ₹51.18 lakh
EMI: ₹41,234/month
Avg rent (2-BHK): ₹25,000–₹30,000 (Kharadi, Hinjewadi, Baner, Wakad range)
Monthly gap: ₹16.2k (EMI > Rent)
Verdict:
Pune’s rental market remains affordable, making renting financially easier in the short run. However, steady employment in IT and education hubs and ongoing infrastructure projects (Metro, ring road) are driving long-term capital appreciation. For families with stability and 10+ year horizons, buying can help capture equity buildup. Investors can also consider hybrid models — buying to let in rental hotspots, while living on rent elsewhere.
Sources: GlobalPropertyGuide, 99acres, Tribestays
E. Hyderabad
Avg price/sq ft (Q2 2025): ₹7,412
Property price: ₹66.71 lakh
Loan (80%): ₹53.37 lakh
EMI: ₹42,992/month
Avg rent (2-BHK): ₹20,000–₹35,000 (Madhapur, Gachibowli, Kondapur)
Monthly gap: ₹21k (EMI > Rent)
Verdict:
Hyderabad continues to show high rental yield potential (3.5–4%) but EMIs remain notably higher than rents. Strong IT hiring, expansion of metro lines, and growth corridors like Financial District and Kokapet indicate strong long-term appreciation. Renting makes near-term financial sense, but buying early in emerging corridors could yield double-digit appreciation over 8–10 years.
Sources: GlobalPropertyGuide, SOBHA Limited, Housing.com
Cross-City Comparison Table (2025)
| City | Avg Price/sqft (₹) | Approx. Property Value (₹ Lakh) | EMI (₹/month) | Avg Rent (₹/month) | EMI–Rent Gap (₹) | Verdict (2025) |
| Mumbai | 12,805 | 115.25 | 74,272 | 35,000 | +39,000 | Rent smarter; buy only for long-term horizon |
| Bengaluru | 7,881 | 70.9 | 45,712 | 31,852 | +13,860 | Buy if long-term job & stable income |
| Delhi NCR | 8,108 | 72.97 | 47,029 | 30,000 | +17,029 | Mixed – rent for liquidity, buy for long stay |
| Pune | 7,109 | 63.98 | 41,234 | 25,000 | +16,234 | Rent-friendly now; buy for capital growth |
| Hyderabad | 7,412 | 66.71 | 42,992 | 22,000 | +20,992 | Rent short-term, buy for 10+ yr outlook |
Interpretation for 2025 Home Seekers
Across metros, EMIs remain 20–80% higher than rents for 2-BHKs in comparable localities. While renting offers liquidity and flexibility, buying builds equity and stability if you plan to stay long-term. City-specific trends matter:
- Bengaluru & Pune: balanced markets, long-term appreciation supportive.
- Mumbai: prohibitive EMIs but high long-term upside.
- Delhi NCR: micro-market dependent; Gurugram can justify buying.
- Hyderabad: rental yields rising, early ownership may pay off.
For investors, hybrid approaches (buy-to-rent or rent + SIP in REITs) can optimize both liquidity and appreciation exposure.
5. Mini-Calculator & Break-Even Logic
One of the most practical ways to decide between renting and buying in 2025 is to run the numbers yourself — using a transparent calculator. Below is a ready-to-use Rent vs Buy mini-calculator logic that works perfectly in Excel, Google Sheets, or even Notion tables. You can simply copy this framework, plug in your local values (city price per sq. ft, rent, loan terms), and instantly see which side makes more financial sense for you.
This calculator shows two layers of comparison:
- Cashflow comparison (monthly): How much you pay every month when you rent vs buy.
- Net-worth comparison (long-term): How much wealth you build over the years through home equity and appreciation — vs the returns you’d earn if you invested the difference while renting.
🧮 Step-by-Step Rent vs Buy Calculator Setup
🔹 Step 1 — Input your basic parameters
You can paste this in Excel or Google Sheets and replace the numbers with your local data.
| Variable | Example Value | Description |
| Area_sqft | 900 | Standard 2-BHK apartment size |
| Price_per_sqft | (City-based) | Example: ₹7,800 (Bengaluru) |
| Purchase_price | =Area_sqft * Price_per_sqft | Total property price |
| Down_payment_pct | 0.20 | 20% of property value |
| Loan_amount | =Purchase_price * (1 – Down_payment_pct) | Home loan amount |
| Interest_rate_annual | 0.075 | 7.5% annual loan interest (ICICI, SBI 2025 average) |
| Tenure_years | 20 | Home loan duration |
| Monthly_rent | (City rent) | Example: ₹30,000 |
| Monthly_maintenance | ₹4,000 | Estimate for property upkeep |
| Property_tax_monthly | ₹500–₹1,000 | Approximation, varies by city |
🔹 Step 2 — Calculate EMI (Monthly Loan Repayment)
Use this built-in Excel or Google Sheets formula:
=PMT(Interest_rate_annual/12, Tenure_years*12, -Loan_amount)
👉 This gives your monthly EMI — the fixed amount you’ll pay the bank every month.
🔹 Step 3 — Estimate Total Monthly Owning Cost
Now calculate your all-in monthly cost of ownership, including loan repayment and other fixed costs.
Monthly_Own_Cost = EMI + Monthly_maintenance + Property_tax_monthly
This value represents your actual monthly expense of owning a home.
🔹 Step 4 — Compare with Monthly Rent
Your rent side is simple:
Monthly_Rent_Cost = Monthly_rent
Now compare both:
Cashflow_Gap = Monthly_Own_Cost – Monthly_Rent_Cost
✅ If Cashflow_Gap > 0: Buying costs more every month (renting is cheaper short-term).
✅ If Cashflow_Gap < 0: Buying saves you money monthly (rare in metros, but possible in Tier-2/3 cities).
🔹 Step 5 — Long-Term Wealth Comparison
Cashflow alone doesn’t tell the full story. The real financial impact shows up over 10–20 years.
A. For Home Buyers
Over n years, your net wealth equals:
Net_Wealth_Buy = (Principal repaid) + (Property appreciation) – (Transaction costs + maintenance + opportunity cost)
Where:
- Principal repaid = portion of loan paid off (builds equity)
- Appreciation = Purchase_price * ((1 + g)^n – 1), where g = expected price growth (e.g., 5%)
- Transaction costs = 6–8% of property value (stamp duty, brokerage, registration)
- Opportunity cost = returns lost on your down payment (if you had invested that money elsewhere)
B. For Renters
If you rent, your wealth depends on what you do with the difference you save between rent and EMI:
Net_Wealth_Rent = (Savings from renting) * ((1 + x)^n – 1)
Where x = your investment return rate (e.g., 10% in mutual funds or SIPs).
This lets you directly see how home equity growth compares with investment compounding over time.
💡 Break-Even Point: When Buying Becomes Better
The break-even horizon is the point where cumulative wealth from owning surpasses wealth from renting.
A simplified version to estimate this in Sheets:
BreakEven_Years = IF(Net_Wealth_Buy > Net_Wealth_Rent, “Buy”, “Rent”)
Generally, in Indian metros (2025 data):
- Bengaluru & Pune: 7–9 years
- Hyderabad: 8–10 years
- Mumbai & NCR: 12–15+ years (due to high price-to-rent ratios)

📊 Lead Magnet Opportunity: “India 2025 Rent vs Buy Calculator”
Turn this model into a downloadable Excel + Google Sheet tool and use it as a lead magnet to grow your blog audience.
Lead Magnet Setup Idea:
- File: “📈 City Rent vs Buy Calculator – India 2025 Edition”
- Sheet Tabs: “Mumbai”, “Bengaluru”, “Delhi NCR”, “Pune”, “Hyderabad”
- Include editable fields for area, price, rent, interest rate, tenure, and appreciation
- Add built-in graphs: EMI vs Rent, Equity Growth Over Time
- Gate it behind an email subscription popup → “Enter your email to get your free Rent vs Buy Calculator!”
This strategy helps you:
✅ Collect email subscribers
✅ Increase engagement (users return for updates)
✅ Boost affiliate conversions for home loan or property platform links
🧭 Quick Example (Bengaluru 2025)
| Parameter | Value |
| Price per sq.ft | ₹7,881 |
| Total cost | ₹70.9 lakh |
| EMI | ₹45,712 |
| Maintenance | ₹4,000 |
| Rent | ₹31,852 |
| Total ownership cost | ₹49,712 |
| Cashflow gap | ₹17,860/month |
Verdict: Renting saves ~₹2.1 lakh per year in cashflow — but buying could catch up in 8–9 years via equity + appreciation.
Key Facts & Statistics Box
(Updated: June 2025 — Verified with RBI, GlobalPropertyGuide, Housing.com, and major lenders)
To help readers interpret the rent vs buy analysis more confidently, here’s a snapshot of the latest macro and micro housing data shaping India’s real estate decisions in 2025. These figures provide an instant benchmark for comparing property costs, rent yields, and financing trends across top metros.
🏦 Interest Rate & Policy Environment
| Indicator | Value (June 2025) | Source & Notes |
| RBI Repo Rate | 5.50% (unchanged since Feb 2025) | Reflects RBI’s cautious stance amid stable inflation (~4.9%) and GDP growth (~6.7%). Source: RBI Monetary Policy Committee, June 2025. |
| Average Retail Home Loan Rate | 7.5–7.8% p.a. | Offered to prime borrowers with good credit scores (750+). ICICI, HDFC, SBI mid-2025 rates fall in this range. Source: ICICI Bank Home Loan Rate Sheet, June 2025. |
| Floating Rate Trend | Marginal softening expected in late 2025 if inflation moderates below 4.5%. | RBI signaled potential easing bias by Q4 FY2025–26. |
Interpretation:
Lower rates compared to 2023 peaks (~8.7–9%) have improved EMI affordability by 8–12%, nudging fence-sitters to reconsider home purchases — though high city prices offset most of the benefit in metros like Mumbai and NCR.
🏘️ Property Prices (Q2 2025 Snapshot)
| City | Avg Price per Sq.Ft (₹) | % Change YoY | Comments |
| Mumbai Metropolitan Region (MMR) | ₹12,805 | +4.9% | Remains India’s costliest market; sustained demand despite high EMIs. |
| Delhi NCR | ₹8,108 | +3.4% | Moderate growth driven by Gurugram & Noida infra expansion. |
| Bengaluru | ₹7,881 | +5.2% | Healthy IT hiring supports steady end-user demand. |
| Pune | ₹7,109 | +4.1% | Balanced market; supply pipeline and metro expansion driving optimism. |
| Hyderabad | ₹7,412 | +6.8% | Fastest-growing metro; new supply in Kokapet, Gachibowli. |
Sources: GlobalPropertyGuide (Q2 2025); Housing.com Market Reports; 99acres Insights.
Interpretation:
Indian metro prices have grown 3–7% year-on-year, slower than pre-pandemic booms but stable — reflecting an end-user-driven, not speculative, market. Price-to-income ratios remain highest in Mumbai (≈10.5× annual income) and lowest in Pune (≈6×).
💸 Rental Yield & Affordability Metrics
| Indicator | India 2025 Average | City Highlights |
| Gross Rental Yield (National) | ~4.8% | Average of major metros (source: GlobalPropertyGuide Q2 2025). |
| Highest Yields | Hyderabad (~5.5%), Bengaluru (~5.1%) | Strong IT migration and leasing demand. |
| Lowest Yields | Mumbai (~3.5%), Delhi NCR (~4.0%) | High property prices suppress yield efficiency. |
Interpretation:
At 4.8%, India’s rental yields are modest compared to global peers (e.g., U.S. ~6%, Singapore ~4%), but improving in Tier-2 hubs. This makes renting financially cheaper in metros, while ownership gains long-term appeal in growth corridors.
📈 Macro Housing Indicators
| Metric | 2025 Value / Trend | Source & Notes |
| RBI All-India House Price Index (HPI) | +3.13% YoY (to Mar 2025) | Moderate, inflation-aligned price growth; reflects steady end-user absorption. Source: RBI HPI Bulletin Q1 2025. |
| Home Loan Growth (YoY) | +14.6% (Mar 2025) | Rising credit flow as banks expand retail portfolios post-policy easing. |
| Housing Inventory Overhang (Top 8 Cities) | ~28 months (↓ from 33 months in 2024) | Indicates improved sales momentum, especially in Bengaluru, Pune, and Hyderabad. |
| Average EMI Affordability Ratio | 36–41% of monthly household income (urban average) | Indicates affordability stress in metros, especially for first-time buyers. |
Interpretation:
The overall real estate market in 2025 is stable, credit-supported, and end-user dominated. RBI data suggests sustainable growth — not a speculative bubble. Lower repo rates and moderate inflation offer a favorable entry window for buyers with long-term intent.
🌏 Global Benchmarks for Context (2025)
| Country | Avg Gross Rental Yield | Mortgage Rate (avg) | YoY Price Growth |
| India | 4.8% | 7.5–7.8% | +3.1% |
| U.S. | 6.0% | 6.9% | +2.5% |
| U.K. | 5.3% | 5.4% | +1.8% |
| Singapore | 4.0% | 4.2% | +4.2% |
| UAE (Dubai) | 7.1% | 4.5% | +6.5% |
Interpretation:
India’s yields are competitive within Asia but lag behind developed rental markets. However, urban population growth and housing demand (driven by 1.4B+ population) ensure long-term price stability and consistent rental demand — especially in IT, education, and infrastructure-led cities.
🧭 Key Takeaways from 2025 Housing Data
- Affordability improved, but only modestly — lower interest rates offset by steady price inflation.
- Bengaluru, Hyderabad, Pune remain India’s most balanced rent vs buy markets, offering fair yields and appreciation.
- Mumbai and NCR remain cashflow-heavy for buyers, best suited for investors with long-term horizons or high liquidity.
- Repo rate at 5.50% and loan rates below 8% mark the most buyer-friendly credit environment since 2021.
- Gross rental yields near 5% signal a healthy, maturing housing market — not speculative, but end-user driven.
Case studies & buyer profiles
- First-time IT professional, Bengaluru — Age 28, single, 2–3 year job mobility: rent (save 30–40% of salary) and invest the difference; revisit buying after 3–5 years.
- Young family, Pune — Dual-income, stable jobs, intend to stay 7–12 years: buy if down payment ready and EMI manageable; choose a non-core premium location for better yields.
- High-income executive, Mumbai — Can afford high EMI; buying in a prime micro-market may make sense for prestige and capital appreciation, but renting delivers major cashflow freedom.
Investor/landlord looking for yield — Instead of buying a high-ticket 900 sqft, consider smaller units or satellite markets with higher gross yields or purpose-built-rental inventory / co-living strategies.
Decision Checklist — When to Rent and When to Buy (Practical Guide for 2025)
Choosing between renting vs buying a house in India (2025) isn’t just about emotion — it’s about cashflow, career mobility, and long-term net worth strategy. Below is a clear, scenario-based checklist to help you decide which path fits your situation. It combines financial logic, housing data, and behavioral insights Indian homebuyers often overlook.
🏠 When to Rent — Smart Financial Flexibility
Renting makes better sense when your mobility, liquidity, or affordability are not yet stable. It’s a strategic choice, not a sign of financial weakness.
✅ Rent if you:
- Expect to relocate within 3–5 years.
- If your job, business, or education might take you to another city, it’s rarely worth paying 6–8% in transaction costs (stamp duty, brokerage, registration) only to sell again later.
- Example: A ₹1 crore flat in Bengaluru could cost ₹6–8 lakh in transaction fees — money you won’t recover in 3 years of modest appreciation (~4–5%/yr).
- If your job, business, or education might take you to another city, it’s rarely worth paying 6–8% in transaction costs (stamp duty, brokerage, registration) only to sell again later.
- Have limited liquidity or emergency savings.
- If making a 20–25% down payment would deplete your cash reserves, renting offers breathing room.
- Financial planners suggest keeping at least 6–9 months of expenses liquid even after a home purchase. If you can’t, it’s better to rent and invest savings elsewhere.
- If making a 20–25% down payment would deplete your cash reserves, renting offers breathing room.
- Face EMI that is multiple times higher than rent.
- In cities like Mumbai and Gurugram, monthly EMIs can be 2.5–3× higher than rent for similar properties.
- Example: ₹1.5 crore home → ₹1.1 lakh EMI vs ₹40,000 rent. Unless you’re expecting high appreciation or long-term use, renting wins for now.
- In cities like Mumbai and Gurugram, monthly EMIs can be 2.5–3× higher than rent for similar properties.
- Work in high-mobility sectors (tech, consulting, startups).
- These jobs often require flexible relocation, project-based contracts, or overseas opportunities. Renting avoids property tie-downs.
- These jobs often require flexible relocation, project-based contracts, or overseas opportunities. Renting avoids property tie-downs.
- Prefer investing surplus money in equities or business growth.
- Renting frees capital that can earn 8–12% CAGR in mutual funds or index ETFs, often outperforming housing appreciation (4–6% in most cities).
- Renting frees capital that can earn 8–12% CAGR in mutual funds or index ETFs, often outperforming housing appreciation (4–6% in most cities).
🧮 Quick Metric:
If (Annual Rent / Property Value) < 3.5%, renting usually wins for the short-to-medium term, especially if your investment return > home price growth.
🏡 When to Buy — Long-Term Wealth & Stability
Buying becomes advantageous when you have financial readiness, emotional stability, and long-term residency clarity. Ownership builds equity and emotional security — if timed right.
✅ Buy if you:
- Plan to stay in the same city for 7–10+ years.
- Real estate returns compound meaningfully after 7+ years, once appreciation offsets transaction costs and loan interest front-loading.
- Example: After ~8 years, principal repayment overtakes interest in EMIs — every EMI builds tangible equity.
- Real estate returns compound meaningfully after 7+ years, once appreciation offsets transaction costs and loan interest front-loading.
- Have a strong down payment (20–30%+).
- A higher down payment reduces EMI, improves loan eligibility, and saves lakhs in total interest.
- Buyers with >30% equity often get better loan margins and rate discounts (0.25–0.50%).
- A higher down payment reduces EMI, improves loan eligibility, and saves lakhs in total interest.
- Can manage EMI near your rent levels.
- If your EMI ≈ rent ±15%, ownership may already make sense — especially if you plan to stay long-term or rent it out later.
- Use the mini-calculator (section 5) to find this break-even EMI-to-rent ratio.
- If your EMI ≈ rent ±15%, ownership may already make sense — especially if you plan to stay long-term or rent it out later.
- Value stability, control, and customization.
- Owning allows renovation, interior design, and rental income flexibility — ideal for families or self-employed individuals.
- Owning allows renovation, interior design, and rental income flexibility — ideal for families or self-employed individuals.
- Want to build “forced savings.”
- EMIs act as disciplined saving: each month, part of your payment builds equity (principal repayment). Over 20 years, this can become ₹50–70 lakh+ in owned value even with modest appreciation.
- EMIs act as disciplined saving: each month, part of your payment builds equity (principal repayment). Over 20 years, this can become ₹50–70 lakh+ in owned value even with modest appreciation.
- Can secure a favorable interest rate or flexible tenure.
- With rates around 7.5–7.8% (mid-2025), even minor negotiation (e.g., 0.25% lower) can save ₹4–6 lakh across a 20-year loan.
- Extend tenure temporarily if needed for cashflow, then use bonus-linked part prepayments to close early — a smart hybrid strategy.
- With rates around 7.5–7.8% (mid-2025), even minor negotiation (e.g., 0.25% lower) can save ₹4–6 lakh across a 20-year loan.
💡 Pro Tips for Smarter Housing Decisions
- Negotiate lender margins: Banks often reduce rates by 0.1–0.25% for salaried professionals or auto-debit EMI setups.
- Account for hidden costs: Always include stamp duty, registration, brokerage, and GST (~6–8%) in your “total cost to own.”
- Run rent-vs-buy calculator yearly: Update rent inflation (≈5%/yr) and home appreciation (≈4–6%/yr) to see your break-even year.
- Factor maintenance escalation: Apartment maintenance typically increases 4–5% annually, affecting long-term affordability.
- Model opportunity cost: Compare what your down payment could earn in safe investments (FD, mutual funds, ELSS).
🧭 Quick Decision Flow (Summary)
| Question | If Yes → Rent | If No → Buy |
| Planning to move within 3–5 years? | ✅ | ❌ |
| EMI more than 2× current rent? | ✅ | ❌ |
| Down payment < 20% without dipping into emergency fund? | ✅ | ❌ |
| Long-term stability (job, family, school, etc.)? | ❌ | ✅ |
| Comfortable with property taxes + maintenance? | ❌ | ✅ |
| Want to build equity and reduce long-term rent outflow? | ❌ | ✅ |
🏁 Bottom Line:
Renting isn’t “wasting money” — it’s paying for flexibility, liquidity, and optionality.
Buying isn’t just an “investment” — it’s a lifestyle and financial commitment that rewards stability and long-term planning.
Your best choice in 2025 India depends not on emotion or social pressure, but on data-backed personal math — and that’s exactly what this rent-vs-buy calculator and guide are designed to help you uncover.
FAQs Section
1. Is EMI lower than rent in India in 2025?
Not in most metros. In 2025, EMI is generally higher than rent for mid-range apartments — especially in Mumbai, Delhi NCR, and Hyderabad.
For example, a 900 sq ft flat costing ₹75–₹80 lakh at 7.5% interest for 20 years results in an EMI of ₹45,000–₹55,000, while rent for the same unit averages ₹25,000–₹35,000. In MMR, the gap is even wider: ₹74,000 EMI vs ₹35,000 rent.
However, smaller units (450–650 sq ft) or properties in Tier-2 cities (e.g., Ahmedabad, Indore, Kochi) may reach near parity — where monthly EMI ≈ rent. Always use your local inputs in a calculator to test parity.
📊 Source: GlobalPropertyGuide Q2 2025; Housing.com rent reports
2. How long must I stay for buying to “pay off”?
Typically, 7–12+ years. That’s when:
- You’ve repaid enough principal (equity build-up).
- Property appreciation compounds enough to offset transaction costs (stamp duty, registration, brokerage).
- Selling doesn’t erase your gains via taxes or fees.
Short stays (<5 years) often don’t justify buying due to 6–8% upfront transaction costs and interest-heavy early EMIs.
💡 Tip: Use the downloadable “Rent vs Buy Calculator” to estimate your break-even year — where owning overtakes renting in net worth.
3. How much should I save for down payment in 2025?
Ideally 20–30% of the property price. A higher down payment lowers your EMI and total interest outgo significantly. For instance, on a ₹75 lakh property, increasing your down payment from 20% to 30% can save ₹8–10 lakh in total interest over 20 years.
Also, always retain an emergency fund worth 6–12 months of expenses post-purchase — to avoid liquidity stress.
📌 Banks like HDFC and ICICI typically offer 75–80% LTV loans at 7.5–7.8% (mid-2025).
4. Do rent increases affect the decision?
Yes — rent inflation can tilt the equation towards buying. If your rent rises 5–8% annually, the cumulative cash outflow over 10 years can exceed ₹40–50 lakh (for a ₹30,000/month rent).
In high-demand tech hubs like Bengaluru and Pune, rent growth has outpaced inflation since 2023, improving the long-term case for ownership.
📈 Key metric: If annual rent growth > property appreciation differential, buying becomes more attractive.
5. Can I buy a smaller unit to reduce EMI?
Absolutely. Many buyers in 2025 downsize or move peripheral to achieve affordability. For example:
- Reducing from 900 sq ft → 700 sq ft can lower property price (and EMI) by ~22%.
- Choosing outskirts (e.g., Whitefield instead of Koramangala) can reduce price per sqft by ₹1,000–₹2,000.
This strategy helps align EMI close to rent while retaining long-term appreciation potential.
6. Are property taxes and maintenance significant?
Yes — and often underestimated.
- Maintenance charges: ₹3,500–₹6,000/month for mid-range gated apartments.
- Property tax: ₹5,000–₹15,000 annually (varies by city).
- These add ~₹50,000–₹80,000/year to ownership costs.
- 📌 Always add them to your EMI when comparing against rent — they can shift cashflow outcomes by 10–15%.
7. Should I choose a floating or fixed rate in 2025?
- Floating rates: Suitable if you expect further RBI repo cuts (currently 5.50% as of mid-2025). They allow you to benefit from future declines but carry repricing risk if rates rise again.
- Fixed rates: Offer predictability, good for long-term planners.
- Hybrid (semi-fixed): Lock a fixed rate for the first 3–5 years, then float thereafter — a balanced option.
💡 Tip: Negotiate with lenders for a “spread cap” — limiting how much above the repo your rate can move.
8. What about renting out my owned property?
Buy-to-let can offset your EMI if your property’s rental yield (rent ÷ price) is above 4%. However, actual net yield after maintenance, taxes, and vacancy averages 3–4% nationally.
While cities like Hyderabad and Bengaluru offer strong tenant demand, manage expectations — real estate is not a passive investment.
📊 Pro Tip: Consider managed rental programs (NoBroker, NestAway, prop-tech co-living platforms) to reduce tenant management hassle.
9. How do taxes affect the rent vs buy decision?
Tax benefits improve ownership math, especially for salaried individuals.
- Section 80C: Deduction up to ₹1.5 lakh on principal repayment.
- Section 24(b): Deduction up to ₹2 lakh on home loan interest.
These can reduce effective EMI cost by ₹2,000–₹4,000/month (depending on tax slab).
⚠️ However, tax rules can change — don’t base the decision solely on deductions; treat them as bonuses, not foundations.
10. Is co-living or managed rental a good option in 2025?
Yes — especially for young professionals, digital nomads, and early-career employees.
Co-living offers:
- All-inclusive rent (utilities, Wi-Fi, housekeeping).
- Flexibility to move cities easily.
- No brokerage or security deposit burden in many cases.
For investors, co-living projects managed by firms like Stanza Living, Settl, or Zolo can yield 1–1.5% higher effective returns due to higher occupancy rates.
11. How to choose between top-tier vs peripheral areas?
- Top-tier areas (e.g., Andheri, Indiranagar, Gurugram Golf Course Rd): Offer better infrastructure, brand value, and price stability — but at premium entry cost.
- Peripheral areas (e.g., Whitefield, Hinjewadi, Thane, Uppal): Offer affordability, rental demand from working professionals, and higher percentage appreciation from base price.
If your goal is capital appreciation, well-connected emerging zones often outperform mature cores (measured in % terms).📈 Strategy: Split approach — buy smaller in periphery for long-term hold, rent centrally for convenience.
12. What documents or steps protect buyers in 2025?
Due diligence is more critical than ever. Before signing, ensure:
- RERA registration of project and builder.
- Title deed, encumbrance certificate, and occupancy certificate are clear.
- Builder has no pending litigation or NCLT proceedings.
- All payments go through bank-approved escrow channels.
- Avoid cash transactions or unregistered agreements.
💡 Pro Tip: Always engage a local property lawyer for high-value deals — ₹10,000–₹25,000 in legal fees can prevent crores in risk.
Quick Summary Table — Rent vs Buy FAQs (2025 Snapshot)
| Topic | Key Insight (2025) |
| EMI vs Rent | EMI > Rent in most metros; parity in Tier-2 cities |
| Break-even Time | 7–12 years minimum |
| Down Payment | 20–30% + emergency fund |
| Rent Inflation | Favors ownership if >5% yearly |
| Property Tax + Maintenance | ₹3.5–6k/month typical |
| Interest Rate | 7.5–7.8% avg; repo 5.5% |
| Tax Benefits | 80C + 24(b) applicable |
| Best Strategy | Buy long-term, Rent short-term |
Summary / Key takeaways
- Locality matters more than the national headline. Mumbai’s high prices mean EMI usually exceeds rent for typical 2-BHK sizes; in other cities the gap can be smaller. globalpropertyguide.com
- Short-term stay (≤5 years) — generally rent. Buying makes sense when you’re confident of a long stay (7–12+ years) or when you can substantially reduce monthly EMI via a larger down payment or lower rate.
- Use a calculator. Small changes in interest rate, tenure, down payment or unit size dramatically change the EMI vs rent outcome (lead magnet opportunity).
- Monetize smartly. The calculator, localized PDFs, lender partnerships and niche affiliate links (moving, interiors, insurance) will convert high-intent traffic.

Conclusion
In 2025, the rent-vs-buy debate in India is no longer about emotion or status — it’s a strategic financial decision. Cities like Mumbai and Delhi still demand sky-high purchase costs with rental yields below 3.5%, making renting far more economical for most professionals. Meanwhile, Bengaluru, Pune, and Hyderabad are showing balanced dynamics, where long-term buyers can justify EMIs with steady job growth and moderate property appreciation. Your decision ultimately depends on two key numbers — how long you plan to stay and the rent-to-EMI ratio. If your monthly rent is less than 60–70% of the EMI for a similar home, renting usually wins.
Over the next decade, India’s real estate market will continue to evolve. Policy incentives, better mortgage options, and rising incomes will make home ownership more accessible, but rentals will stay relevant as urban migration, co-living trends, and flexible work lifestyles grow. Smart buyers will use calculators and city-level data, not just instincts, to decide. The smartest investors, on the other hand, will use both strategies — owning where appreciation potential is high and renting where lifestyle flexibility or liquidity matters more.
The takeaway is simple: there’s no one-size-fits-all answer. Renting can be the better wealth strategy if you invest the saved capital wisely; buying can be powerful if you choose the right city and hold long enough. In 2025, the winners aren’t those who own the most — but those who make informed, data-backed, flexible choices about where and how they live. Use the calculator, review your city data yearly, and treat your home not just as shelter, but as a strategic part of your financial plan.
References & sources
- RBI / repo rate reporting (June 2025). bajajhousingfinance.in
- ICICI bank home loan rate page (sample retail rate approx 7.65%). ICICI Bank
- JLL India Residential Market Dynamics (Q2 2025). jll.com
- GlobalPropertyGuide — city price per sq ft Q2 2025 (MMR, Bangalore, Delhi NCR, Pune, Hyderabad). globalpropertyguide.com
- Housing.com / 99acres city price pages and rent listings (Mumbai / Bengaluru / Delhi / Pune / Hyderabad). 99acres.com+4Housing+4Housing+4
- Rentok, CirclEpe and other rent trend writeups (2025 rental ranges). rentok.com+1
Economic Times coverage on interest-rate cut benefits for home-loan borrowers (June 2025). The Economic Times